
Glassbrain helps teams visually debug LLM apps by capturing every OpenAI, Anthropic, and LangChain call and replaying failed runs.
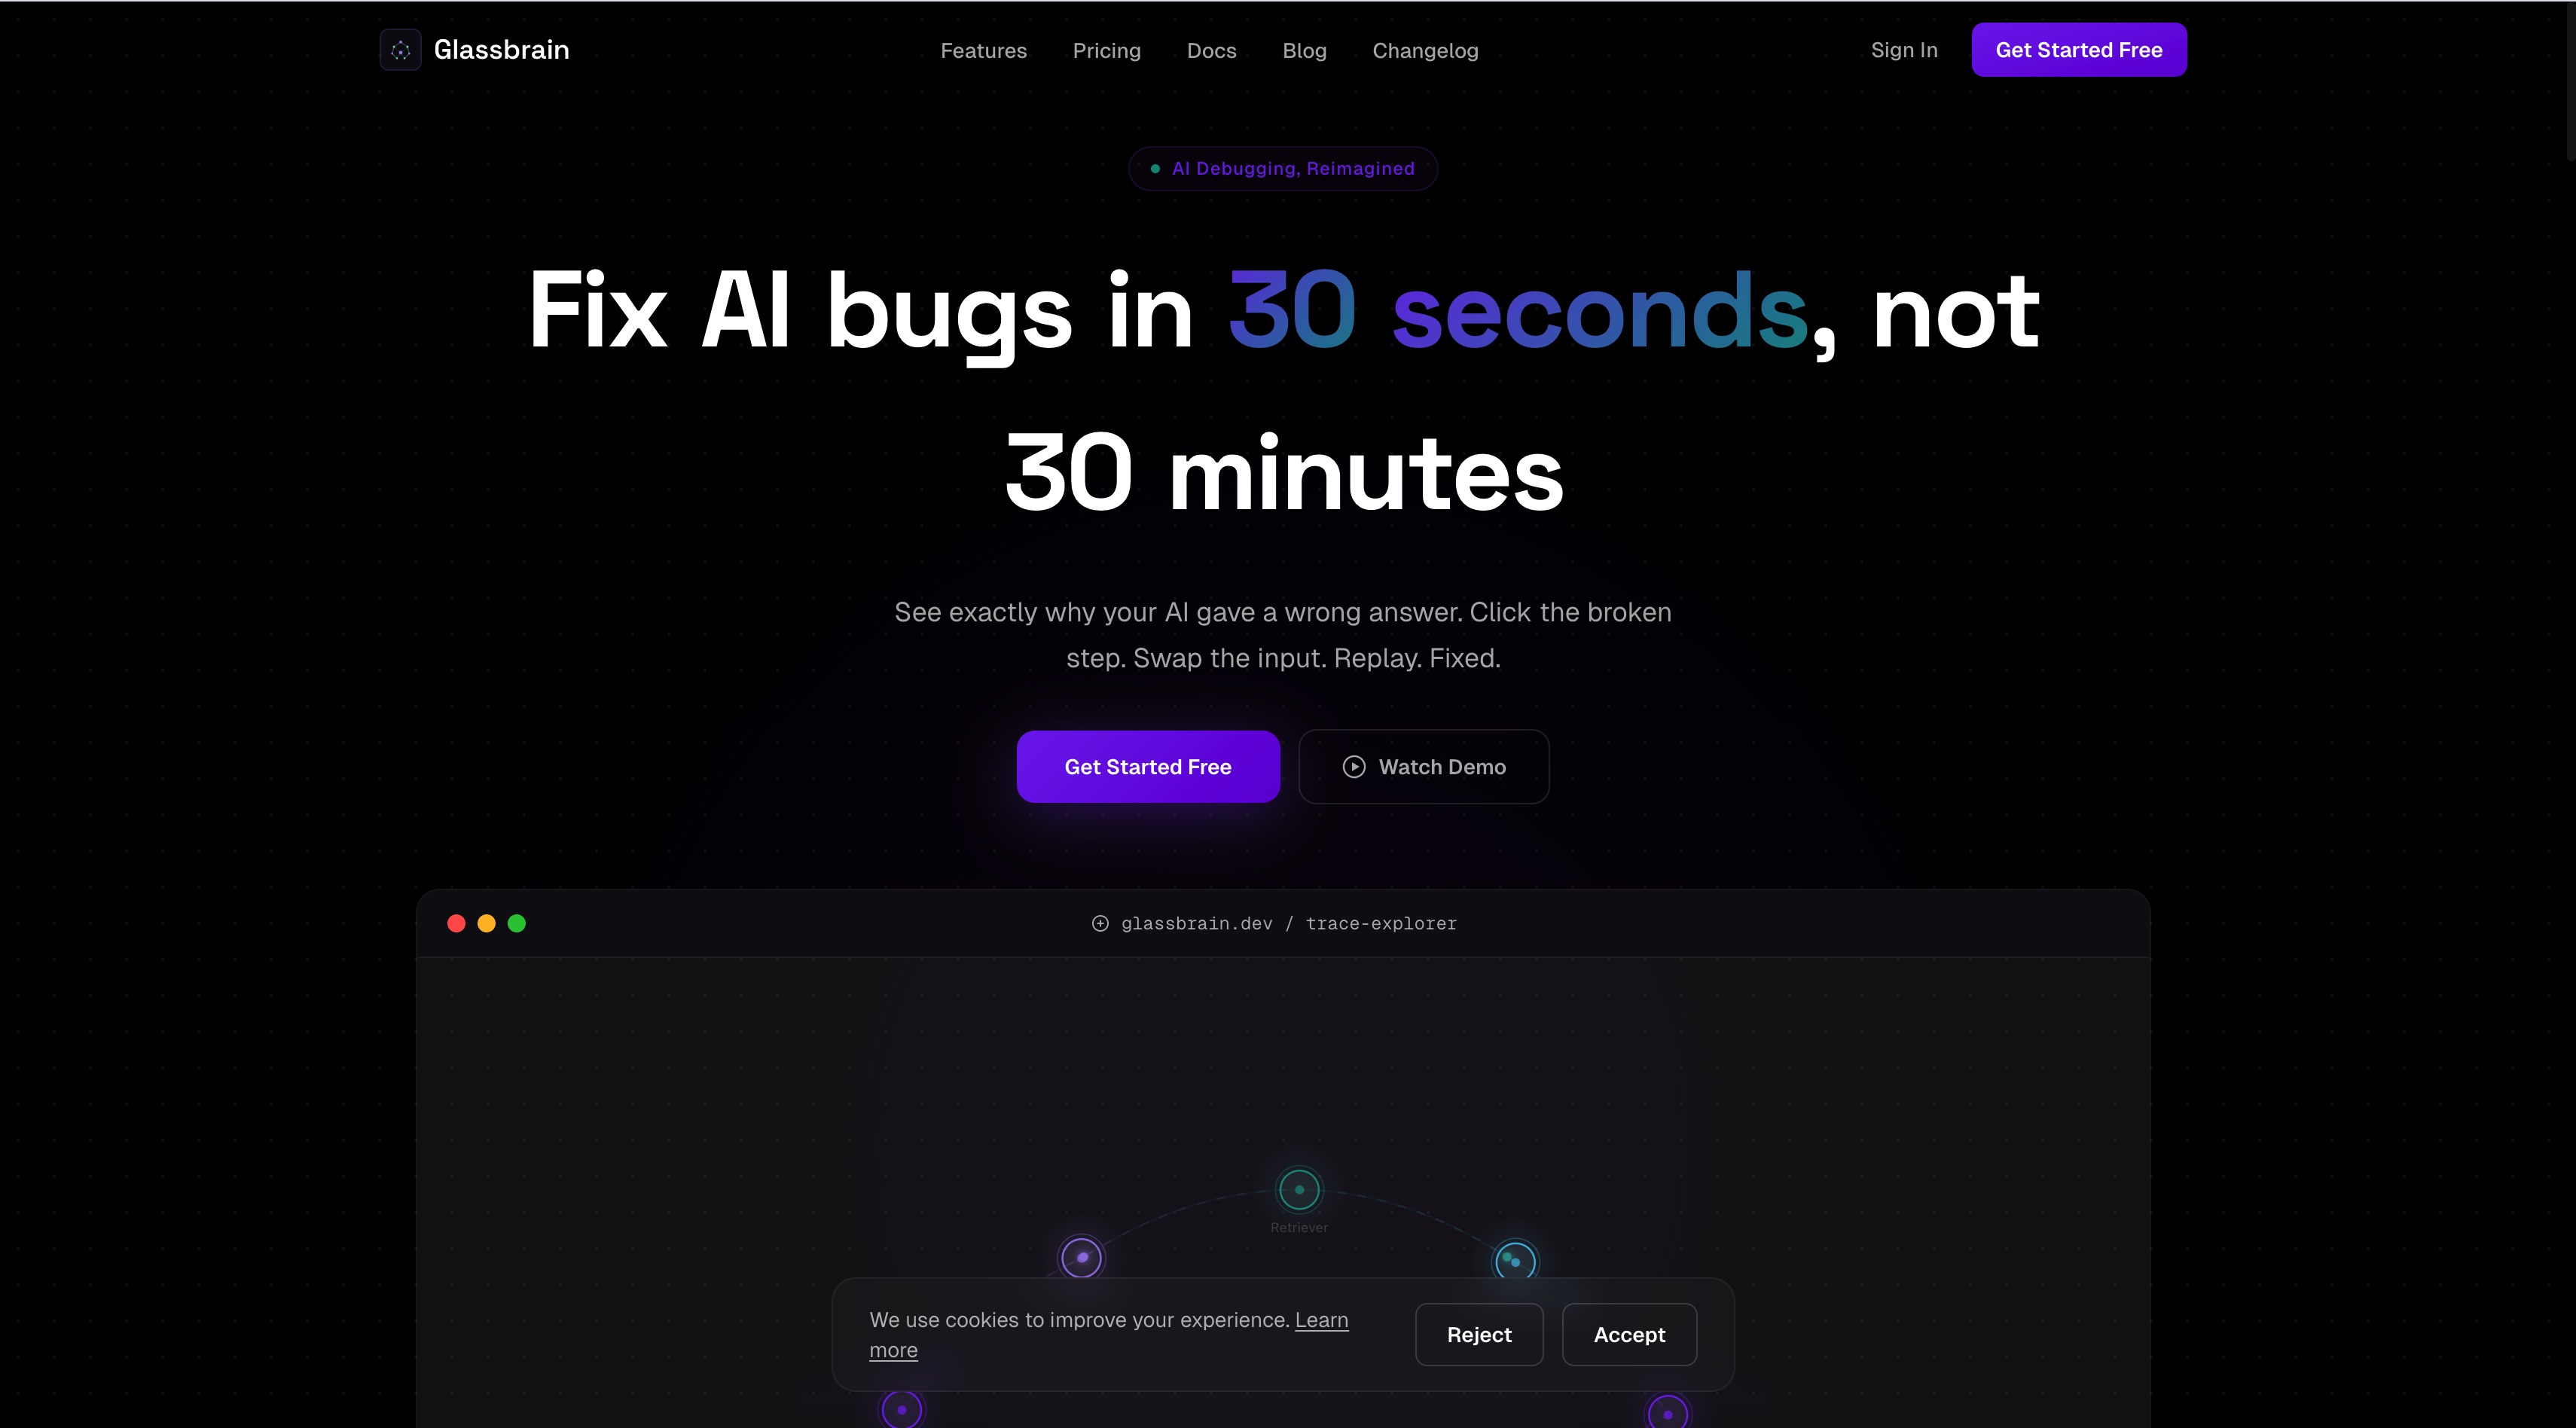
Features
- Visual trace view for LLM call chains
- Capture OpenAI, Anthropic, and LangChain requests
- One-click replay of failed runs
- Pinpoint broken steps and input differences
- Fast validation of fixes
- Developer-focused debugging workflow
Use Cases
- Production troubleshooting for LLM apps
- Prompt and workflow error localization
- Replay of failed agent workflows
- Analysis of model-call anomalies
- Team collaboration on debugging
- Shorter AI feature fix cycles
FAQ
Glassbrain helps engineering teams debug LLM apps visually by capturing every OpenAI, Anthropic, and LangChain call, replaying failed runs with one click, and validating fixes quickly to reduce debugging time. Core capabilities include: Visual trace view for LLM call chains, Capture OpenAI, Anthropic, and LangChain requests, One-click replay of failed runs.
Common scenarios include: Production troubleshooting for LLM apps, Prompt and workflow error localization, Replay of failed agent workflows.